Logs
The Logs page provides a comprehensive view of your DFX Dashboard command history, allowing you to review, re-execute, and analyze past commands run within the DFX Dashboard.
Overview

The Logs page displays:
- A table of executed dfx commands
- Options to view command outputs, re-execute commands, and copy command text
- Filtering and search capabilities
INFO
Only commands run through the DFX Dashboard are recorded here, not those executed in your terminal.
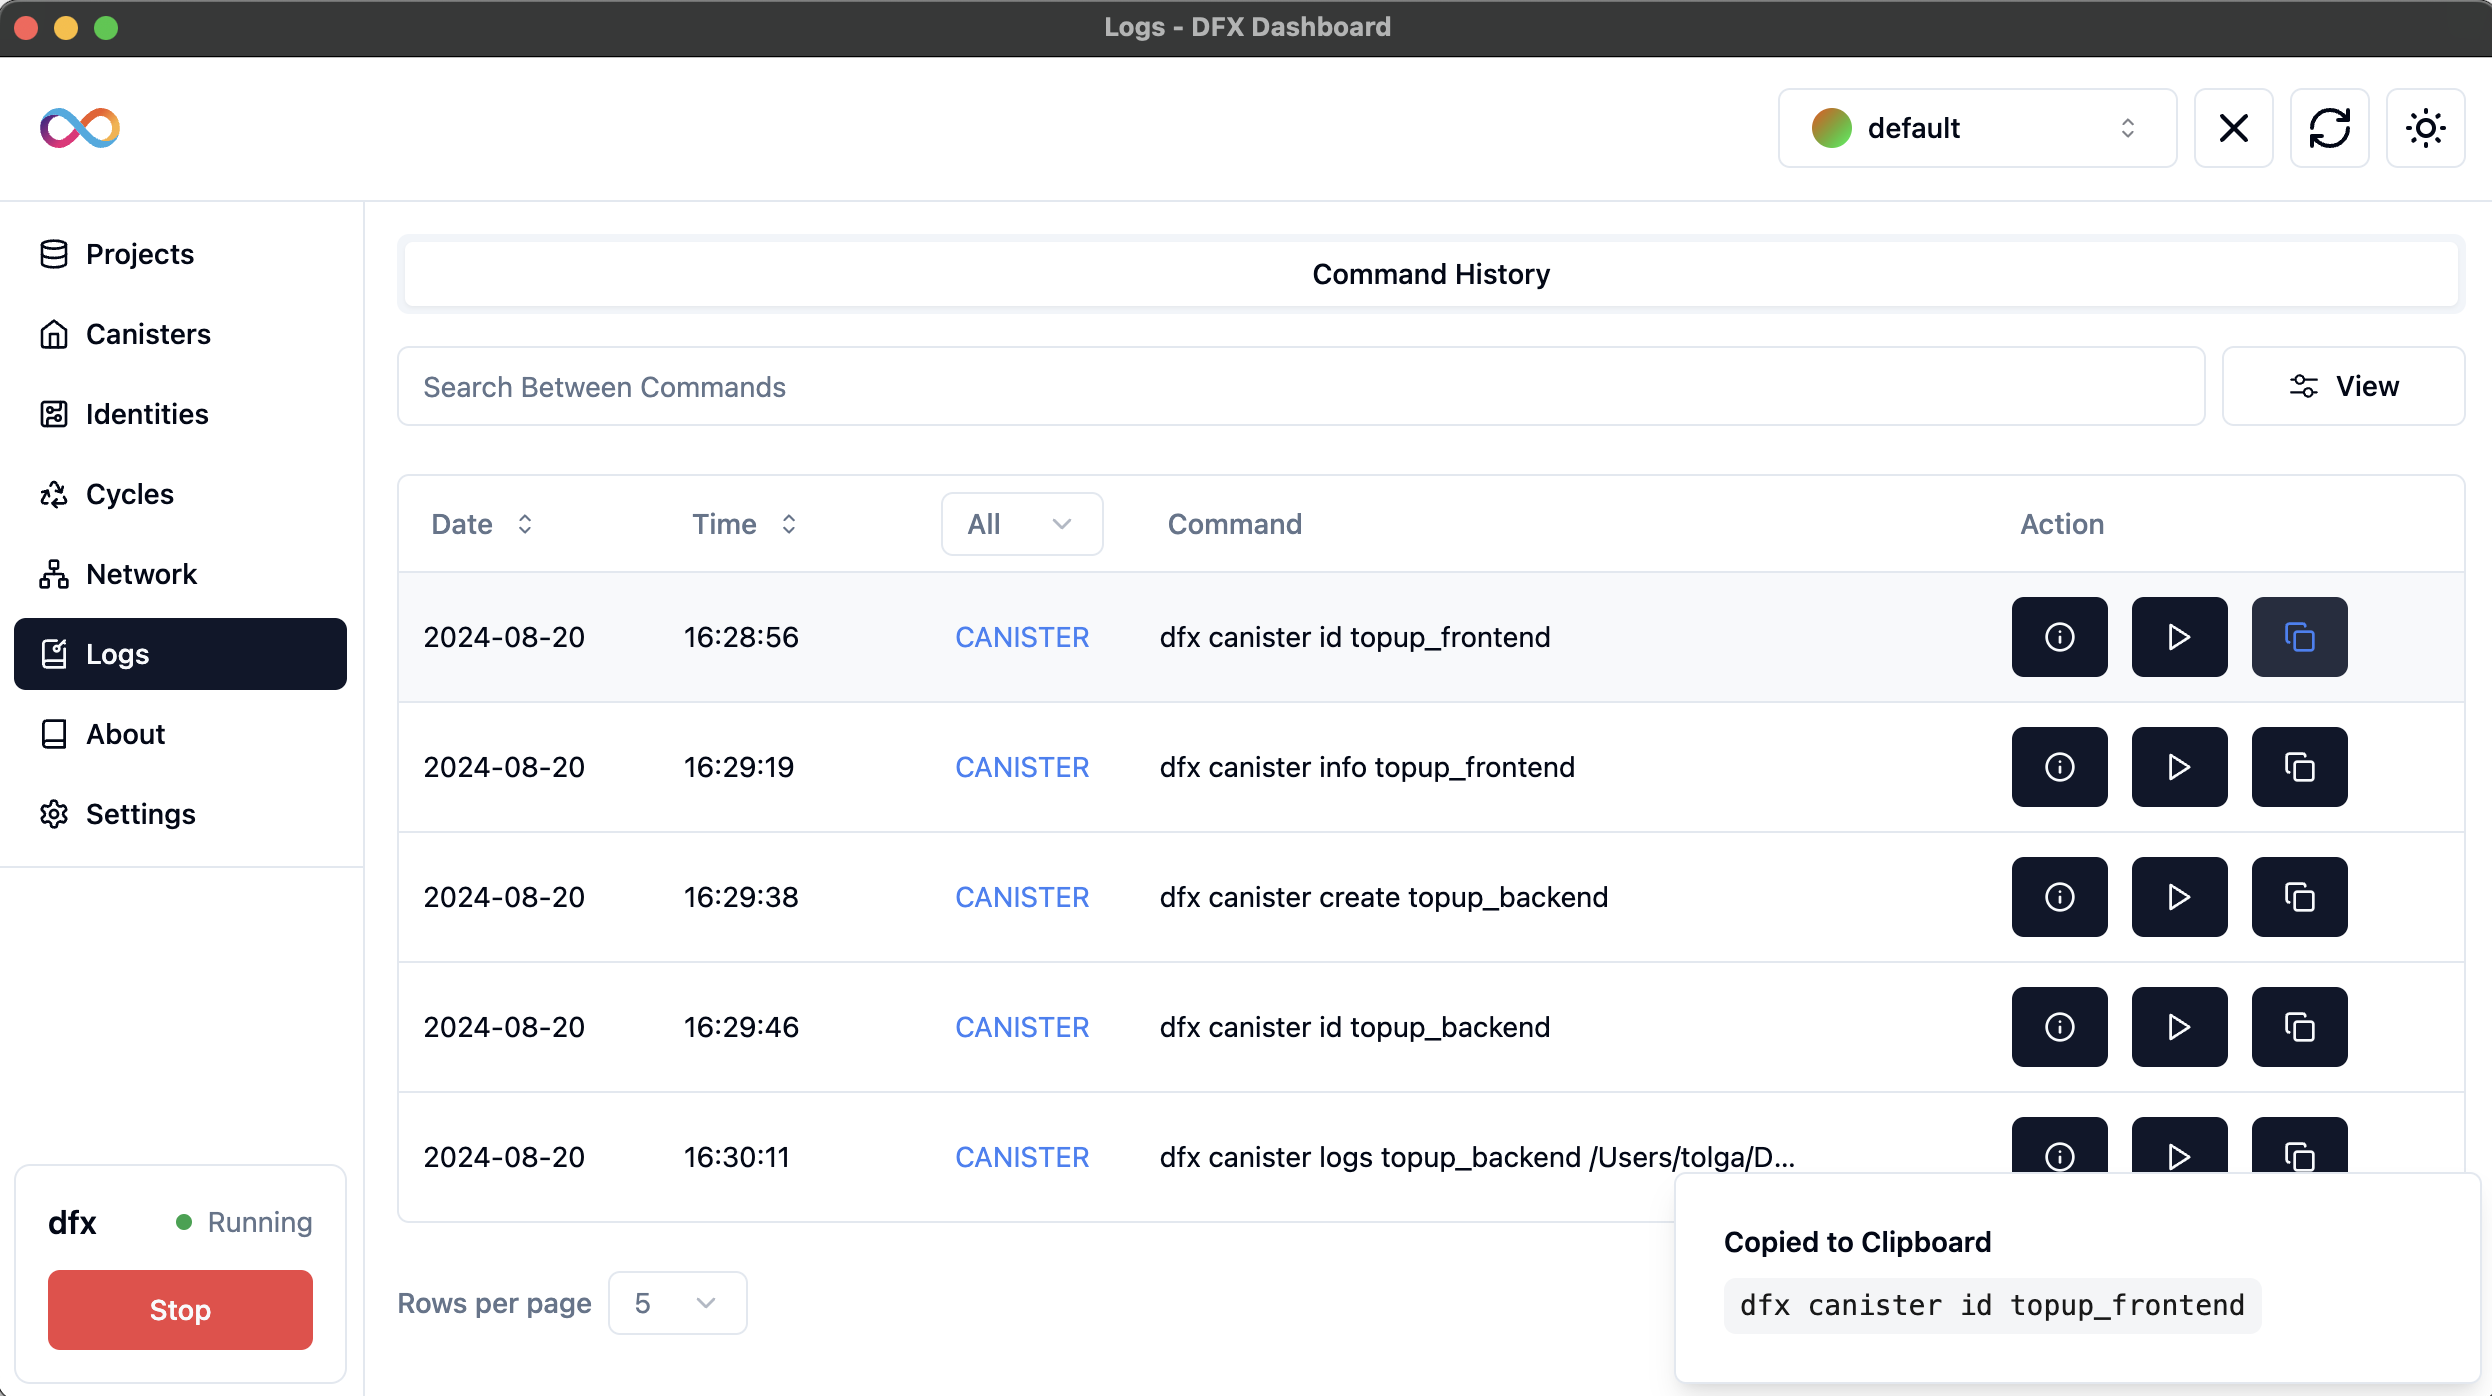
Command History Table
The command history table includes the following columns:
- Date: The date when the command was executed.
- Time: The specific time of command execution.
- Type: The category of the command (e.g., CANISTER).
- Command: The actual dfx command that was run.
- Action: Buttons to interact with the command (view output, re-execute, copy).
TIP
Use the Date and Time columns to track your project's development timeline and identify when specific actions were taken.
Interacting with Commands
For each command in the history, you have three action options:
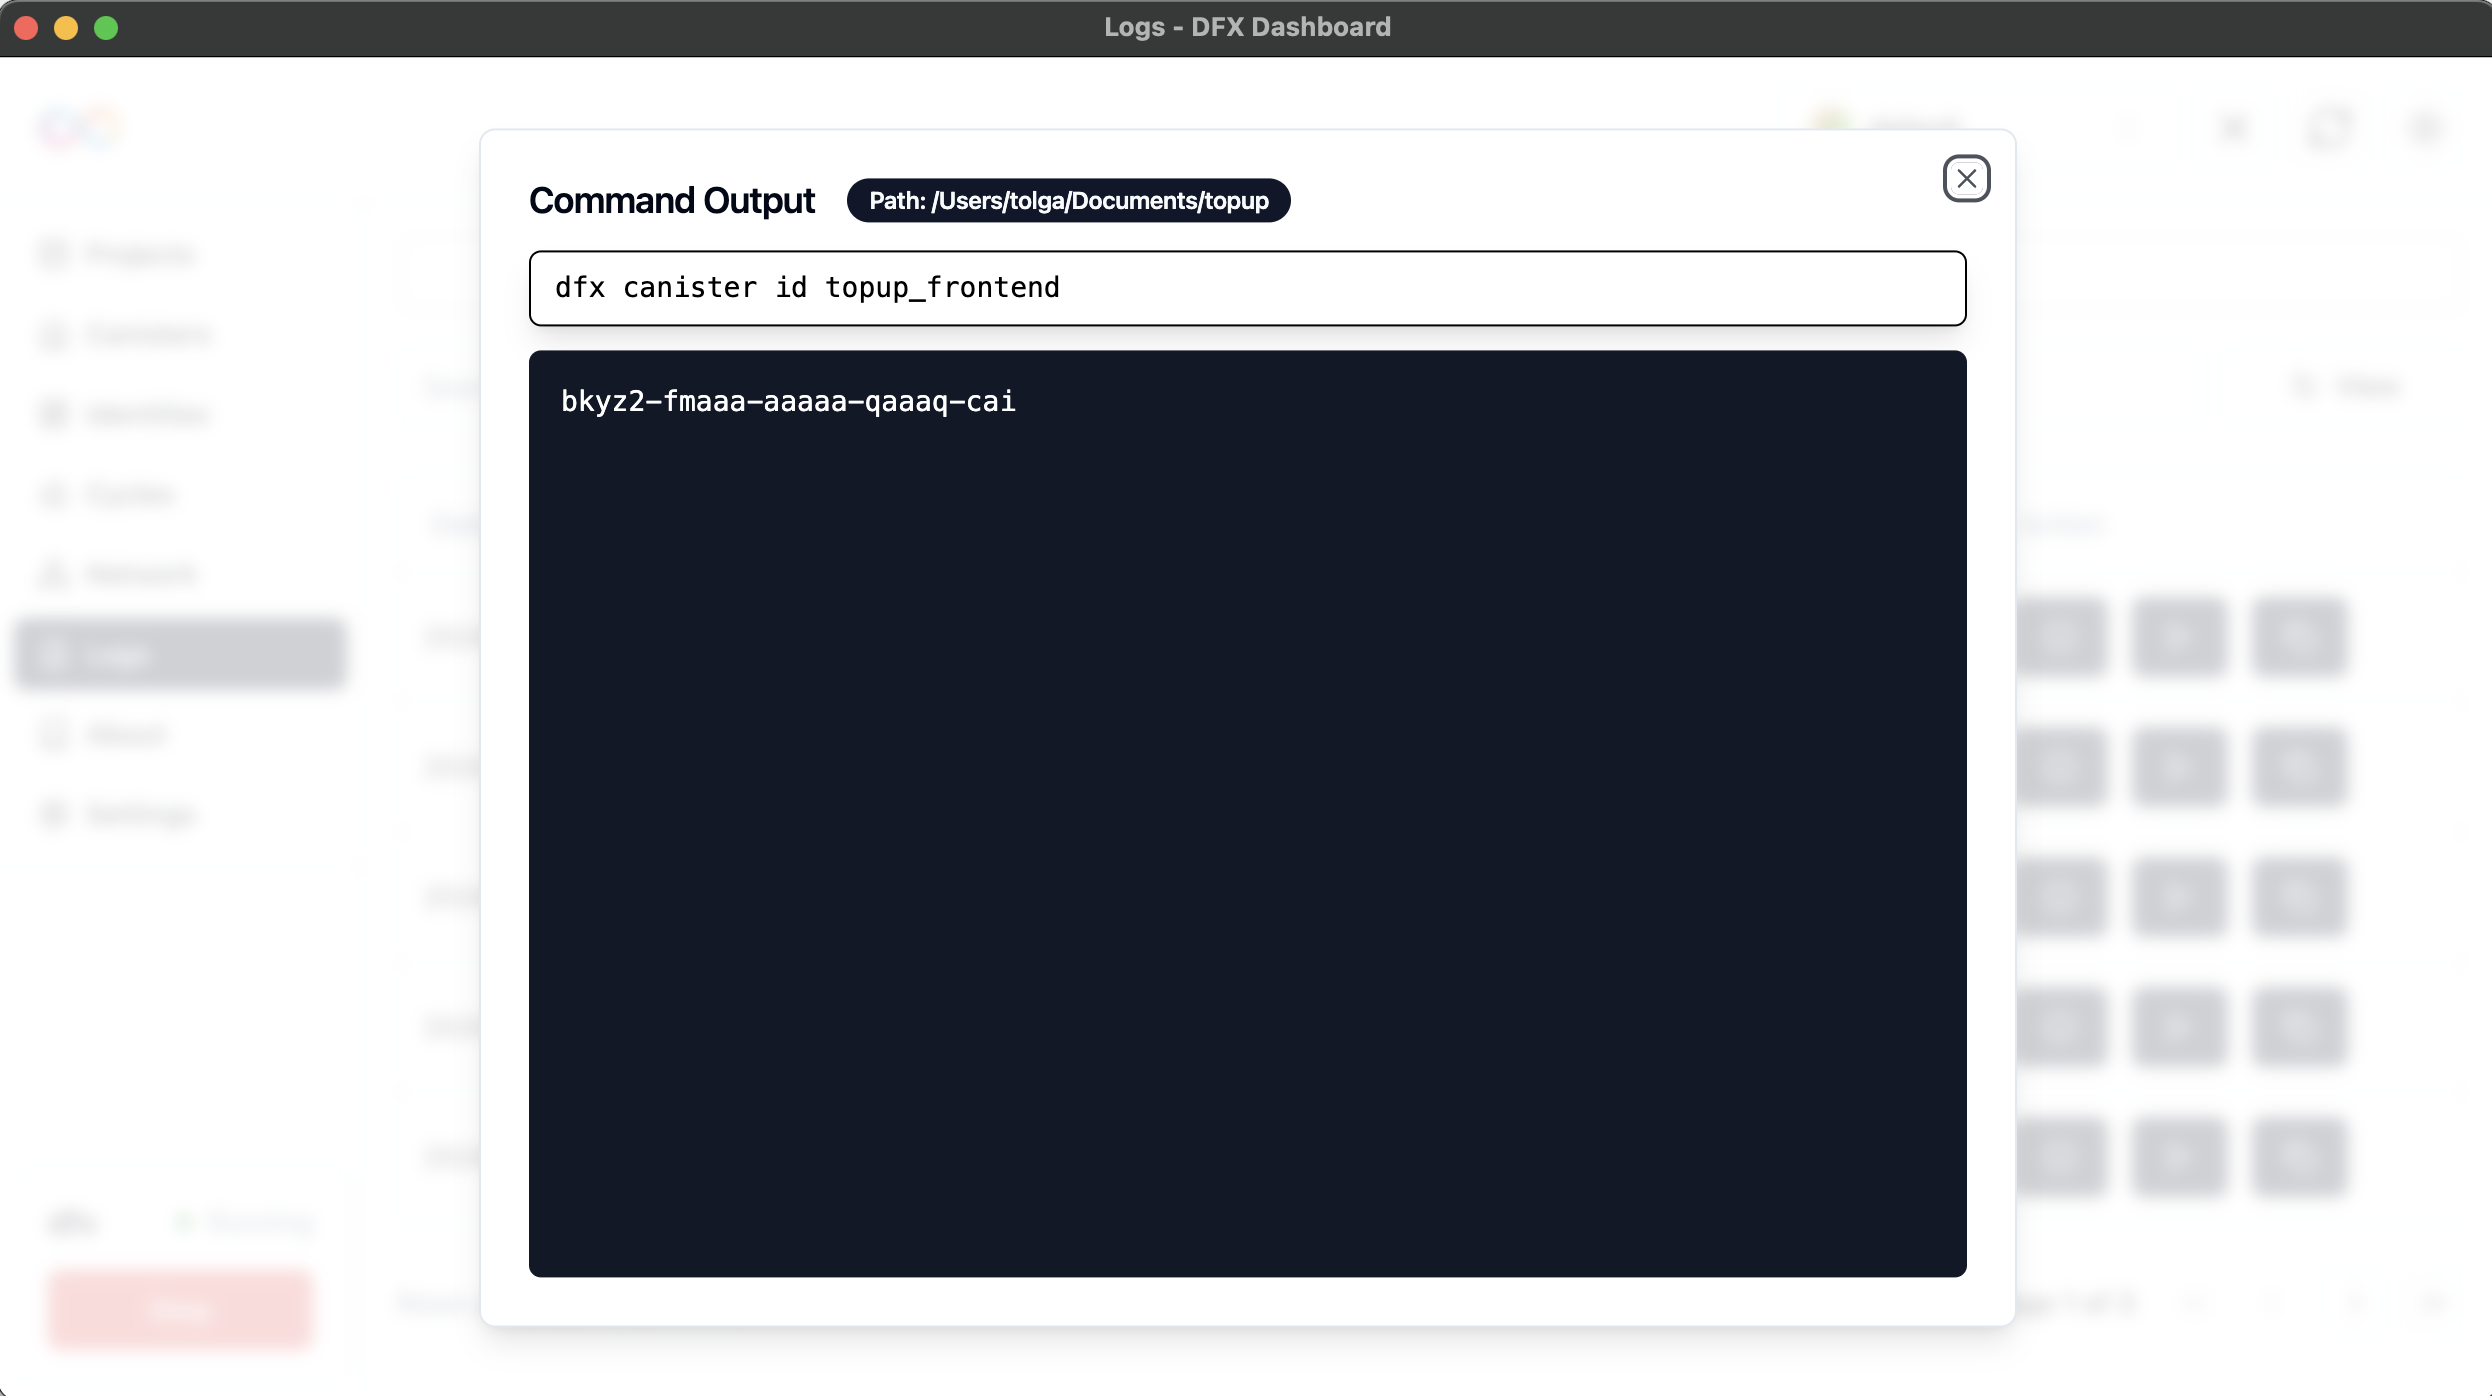
- View Command Output (ⓘ icon):
- Click to open a modal showing the command's output.
- The modal displays the command, its execution path, and the resulting output.
Re-execute Command (▶ icon):
- Click to run the command again within the DFX Dashboard.
- Useful for repeating actions or comparing results.
Copy Command (📋 icon):
- Click to copy the command text to your clipboard.
- A confirmation message "Copied to Clipboard" will appear briefly.
WARNING
Be cautious when re-executing commands, especially those that modify canister state or deploy code. Ensure you understand the implications of running the command again.
Filtering and Searching
The Logs page offers several ways to locate particular commands:
- Search Bar:
- Use the "Search Between Commands" field to find specific command text.
- Date and Time Sorting:
- Click on the Date or Time column headers to sort commands chronologically.
- Type Filter:
- Use the dropdown (defaulted to "All") to filter commands by their type.
- Pagination:
- Navigate through multiple pages of command history using the pagination controls at the bottom.
- Rows per Page:
- Adjust the number of commands displayed per page using the dropdown at the bottom left.
TIP
Combine search and filtering options to quickly locate specific commands, especially when troubleshooting issues or reviewing project history.
Best Practices
TIP
Optimize your use of the Logs feature:
- Use the re-execute feature to quickly repeat common tasks.
- Utilize the copy feature when you need to run a command with modifications in your terminal.
- Use the search and filter options to quickly find specific commands in a large history.
- Regularly review your command history to understand your project's development progress and identify areas for workflow optimization.
- Use the command history to document your development process or create tutorials for team members.
Troubleshooting
WARNING
Watch out for these common issues:
- If a command's output is unexpected, try re-executing it to see if the issue persists.
- If you can't find a command you remember running, ensure it was executed through the DFX Dashboard and not directly in your terminal.
- If re-executed commands consistently fail, check your project's current state and environment variables.
- For commands with long outputs, use the scroll function within the output modal to view all information.
- If the Logs page is loading slowly, consider clearing old logs or increasing the number of rows per page to reduce pagination.